第2章:非图表描述(1):线形图和柱状图描述(5)
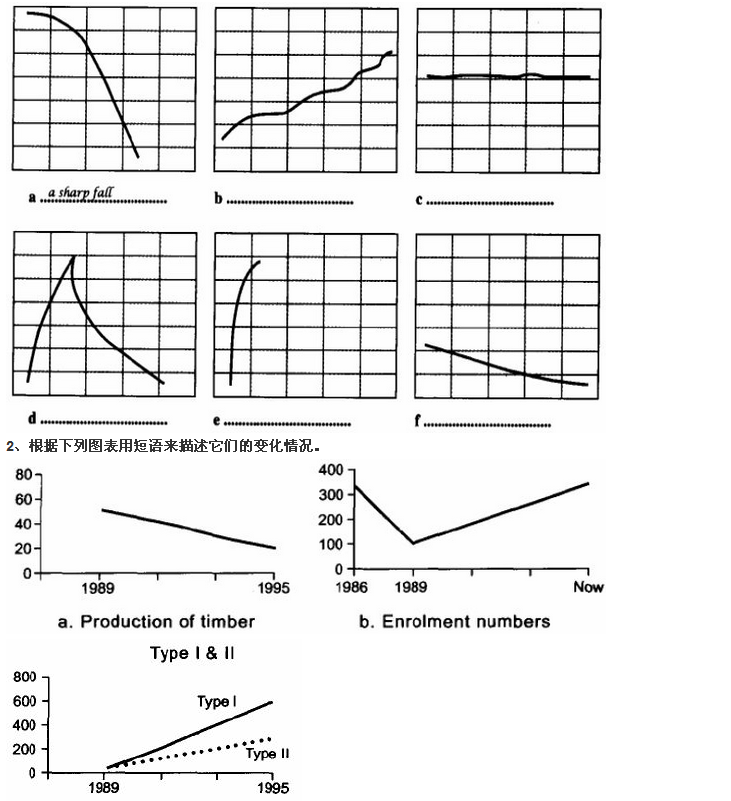
1、请用本届学习到的单词或短语将下列图表的变化用文字形式描述出来。
3、用适当的介词填空。
a. The shares peacked______23p in July.
b. Sales fell_____$3m______$6m.
c. There was an increase______just over 50 thousand people.
d. In the first decade the population remained steady_______ approximately 5 million.
e. There was a decrease______net profit.
f. Sales rose______$3m. This was a rise_______approximately 2%.
g. Employment fell______just over 123 000 people.
h. Violence in the city peaked____about 1200 deaths per 1000 people.
i. After an initial increase, the city pollution levels remained constant______5 pm.
j. The population is expected to grow sharply over the next few years and then peak_____30 million peo
ple.
k.The production of goods is predicted to finish the year______40 units per day.
l. Production began____50 units per day and rose_____about 21 units per day to end the month____well over 500 units.
参考答案:at/from/to/of/at/in/by/of/to/to/at/at/at/by/at
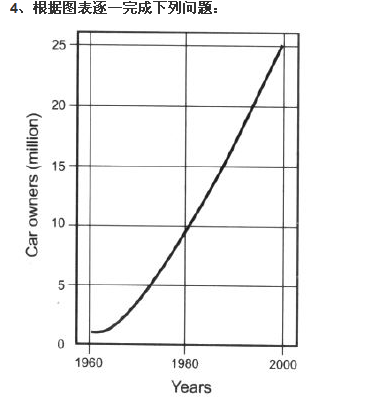
b. What do the numbers along the horizontal axis represent?
c. What do the numbers on the vertical axis represent?d. Now include the time period. Use: Since 1960(over a 40-year period) between 1960 and 2000
f. Now include the number of car owners in both sentences.(This may mean that you have to reorganise y
our sentence.)
vehicle n.车辆 horizontal a. 水平的 n.水平线;水平面 axis 轴线 represent vi.代表,象征;代表、代理;扮演vertical a.垂直的;竖的,立式的
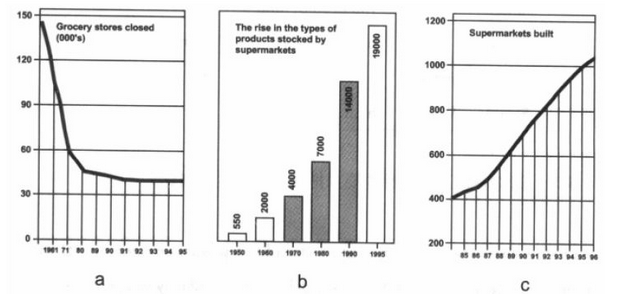
5、 请看下面的三幅图表,先用一句描述出该图表的主题,然后对其趋势变化进行描述。
6、 参看本单元的“Number of new model cars produced”线形图,用一个单词或短语将下面这段描述补充完整。
There was a(n)_________________ in car production for the first three months. For the next six months the number of cars produced___________. The for five months production__________.There was a slight_______over the next seven months before it___________ for the final three months.
7、请根据下图回答问题。

a. what tense will you use to describe it?
b. Write four sentences about the trends you can see in the above graph. See how many different types of structures you can produce and write them all down. Practice using the words stable, fewer,rise,sales,peak,drop.popuar.
8、变化注意的练习。

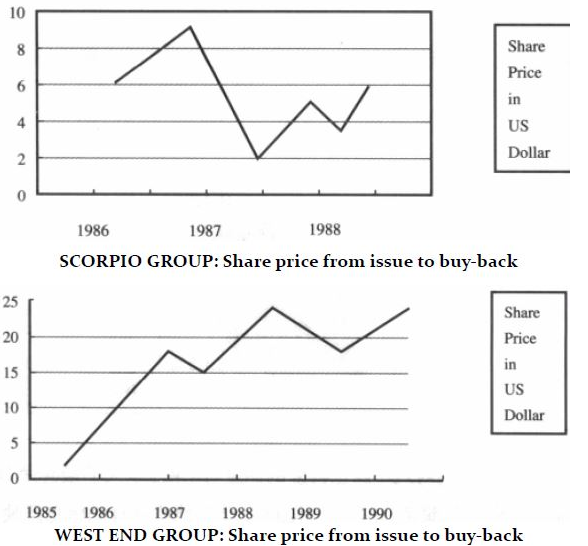
9、图表写作练习。请你根据下面题目的要求把该图表描述出来。
a. The graphs below show the changing share prices of two private companies that went public and issued shares on the stock exchange. Both companies were eventually bought back by their previous owners.
Using the information from the graphs, write a short report describing the general movement of the share prices and comparing the performance of the two companies between the issue date and the buy-back date.
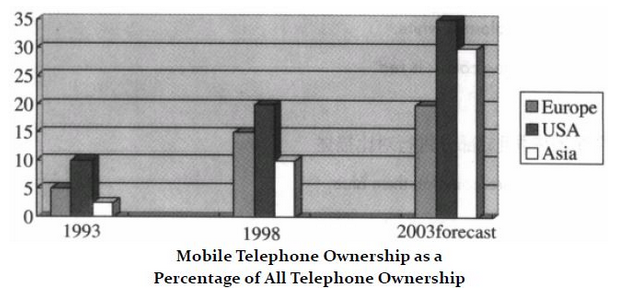
b. The graph below shows development in the ownership of mobile telephones as percentage of telephones owned.
Using the information from the graph,write a short report on changes in telephone ownership.
